SEDz-Star

Star Formation Histories for 6 < z < 12 Galaxies in the GOODS-S Field
Alan Dressler and Chris Burns -- Carnegie Institution for Science
March 2024
The data in this site is from the paper Dressler+2024, ApJ, in press, 2023arXiv2306:02469D. JWST-NIRCam imaging in 9 near-IR bands (0.90um to 4.44um) of the GOODS-S field were used exclusively for this study; this site contains all the input data, and all the output measurements used in this paper.
The measured fluxes were drawn from catalog v0.7.2 of the GOODS-S field produced by the JADES team (NIRCam&NIRSpec). The object numbers recorded here are unique to that catalog: exact positions for the galaxies in the study can be used to find other designations from subsequent catalogs, for example, to look for NIRCam spectra of these galaxies.
The data file contains observed data, 9-band NIRCam fluxes -- the SED (spectral energy distribution) and the processed output of SEDz*, a fortran program that fits the SED with a least-squares-optimized combination of young, stellar populations, all dominated by A-stars.
The 894 galaxies that were used in the first version of the paper were pared down to 883 for this final data set, eliminating 11 more objects near diffraction spikes or borderline at S/N = 5.
The data are recorded in a 883-record csv (comma separated variable) file as described below. Also presented are plots in png format for each of the SEDz* solutions that best match the observed SED through non-negative-least-squares combinations of 7 stellar-population templates covering the redshift range 6 < z < 12 (ages 1Gyr -- 340Myr).
Basic data: 9 NIRCam bandpasses (in micros):
| F090W | F115W | F150W | F200W | F277W | F335W | F356W | F410W | F444W | |
|---|---|---|---|---|---|---|---|---|---|
| High: | 1.005 | 1.282 | 1.668 | 2.226 | 3.127 | 3.538 | 3.990 | 4.301 | 4.986 |
| Low: | 0.795 | 1.013 | 1.331 | 1.755 | 2.416 | 3.177 | 3.140 | 3.864 | 3.880 |
The catalog is available in the following formats:
- Raw comma-separated variable (CSV) file
- CSV data in a google sheet (with links to SED plots)
- JSON format
Each line in the table records a single object's data and solution.The fields have the following meanings:
| Name | Description |
|---|---|
| AD, RA, DEC | The object number (NIRCam catalog v0.7.2), RA(2000), DEC(2000) |
| S/N | The signal-to-noise, computed as the average S/N of fluxes F200W and F277W |
| mass | log10(Mtot), the total mass of the galaxy found by SEDz*, in solar masses |
| type | The ‘star-formation-history’ type, as in Dressler+2024 |
| SEDz, ez, z(adopted) | Redshifts: SEDz (from SEDz*), EZ (Hainline+2022), and zSED -- adopted redshift |
| chisq | The chi-square value of the SEDz* `best NNLS fit’ |
| flux[i], i: 1..9 | Object SED --- observed NIRCam fluxes in 9 bands (see above) |
| e_flux[i], i: 1..9 | The cataloged errors in the fluxes, from readnoise and object flux (including uncertainties from modeling extraction) |
| model[i], i: 1..9 | SEDz*model solution, 9 fluxes, median of 21 trials |
| model_lo[i], i: 1..9 | SEDz*model solution, 9 fluxes, bottom quartile |
| model_hi[i], i: 1..9 | SEDz*model solution, 9 fluxes, top quartile |
| SFH[j], j: 1..12 | SEDz* SFH: log10 stellar mass in epochs (z = 6 -- 12 for this sample) |
| SFH_lo[j], j: 1..12 | SEDz* SFH 1𝜎 high bound |
| SFH_hi[j], j: 1..12 | SEDz* SFH 1𝜎 low bound |
| Mflux[i,j], i: 1..9, j: 1..12 | SEDz* model flux from z = z[j] epoch stellar mass in bandpass i. |
The stored png files show the SEDz* output for each of the 883 galaxies in the sample. The example here is a redshift z = 7.4 galaxy with a long SFH, beginning with 2 x 10⁸ M⊙ at z = 12.
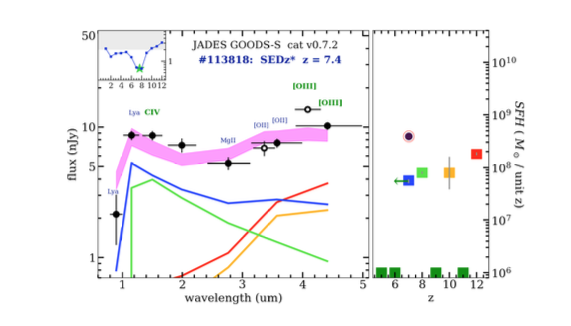
The left panel shows the observed SED (black points with error bars) from 9-band NIRCam imaging and the NNLS fit of SEDz*. The magenta band is the `quartile range' of 21 trial solutions, made by perturbing the observed data by 1𝜎 random errors. The run of 𝝌2 is shown in the insert at upper left; the green star marks the observed redshift. Most important is the SFH corresponding to this best fit, shown in the right panel. Each epoch of star formation, in solar masses, is recorded as a small colored box. For each epoch that contributes to the SED fit, the flux contributed to the solution is plotted in the left panel, as a line of the same color (below the observed SED). Error bars, based on the quartile ranges of the SEDz* fit, are typically smaller than the boxes. Error bars do not include systematic errors, such as those associated with photometry at these faint levels, but these are unlikely to perturb the shape of the SEDz* solution.